What is Optogait?
Optogait is an innovative system for movement analysis and functional assessment of patients with normal or pathological conditions. The system is equipped with optical sensors working at a frequency of 1000 Hz and having an accuracy of 1 cm, detecting the relevant space and time parameters for gait, running or other test types. The objective measurement of such data, combined with an integrated video acquisition, allows monitoring of a patient’s condition on a constant basis, detecting problem areas, assessing mechanical inefficiencies and rapidly verifying the existence of asymmetries between the two legs.
The software platform allows easy storage of all tests carried out and the ability to recall them instantly if necessary. This allows the development of a customized patient recovery plan. It is also possible to compare very quickly and easily data of tests carried out at different times, in order to assess the validity and the efficiency of the methodology applied.
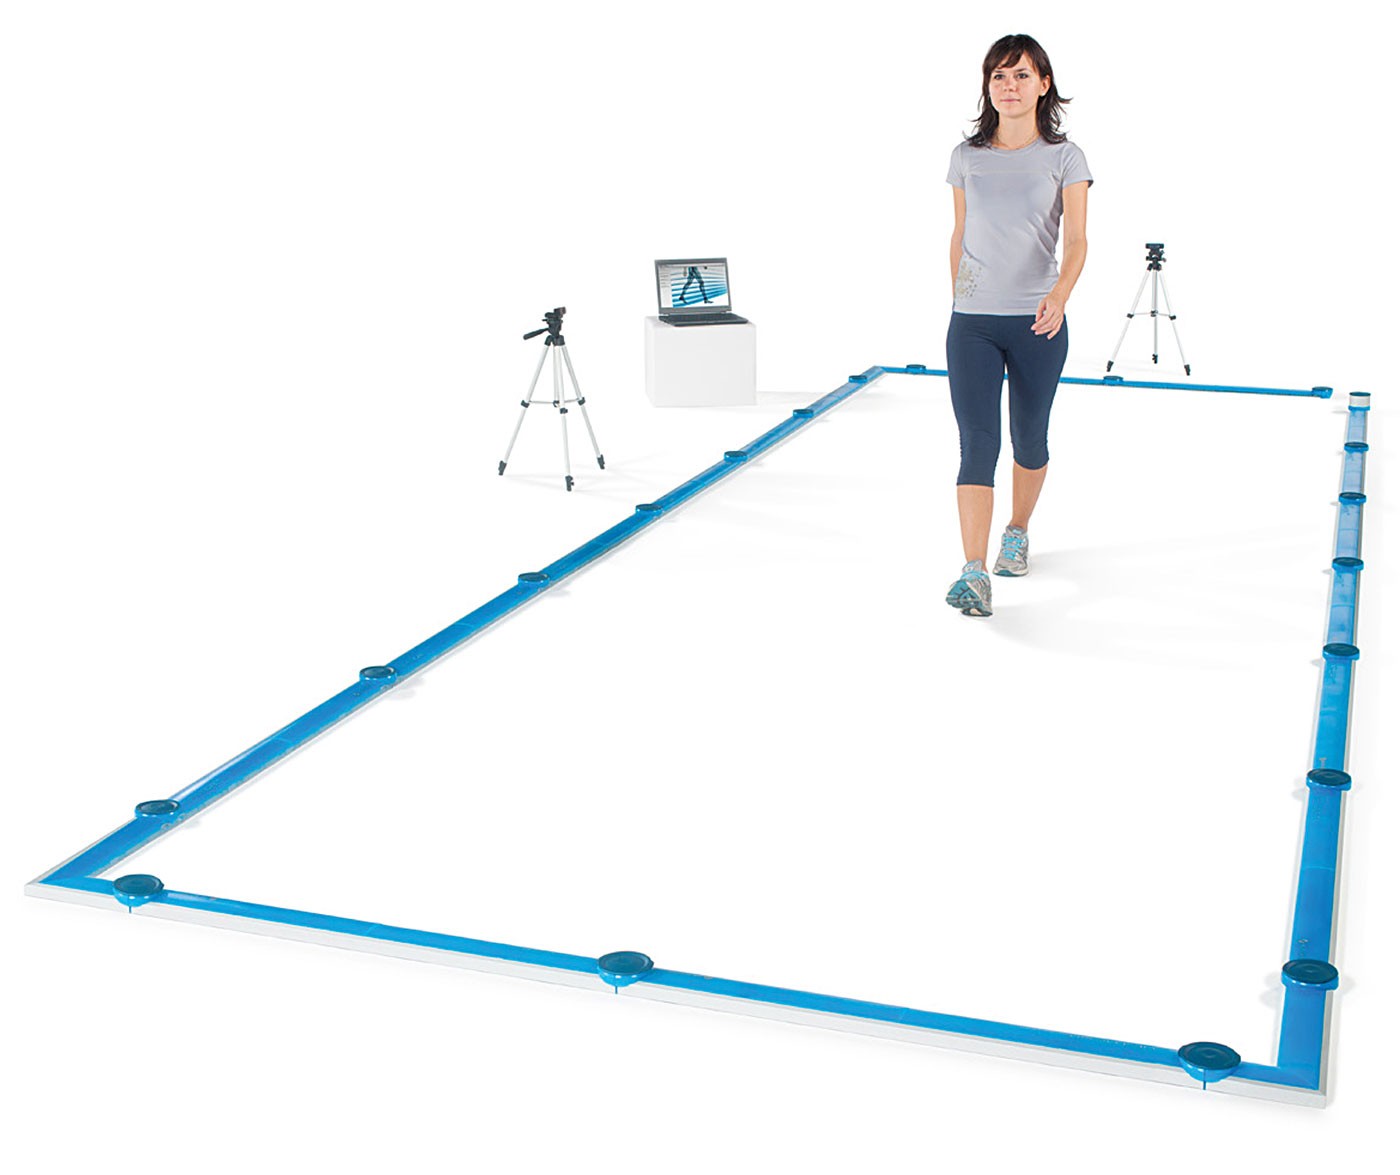
Gait analysis
The Gait analysis is the study of human locomotion, using the eye and the brain of observers, augmented by instrumentation for measuring body movements, body mechanics, and the activity of the muscles. Gait analysis is used to assess, plan, and treat individuals with conditions affecting their ability to walk. It is also commonly used in sports to help athletes run more efficiently and to identify posture-related or movement-related problems in people with injuries.
By acquiring the fundamental parameters of their patient’s gait, OPTOGAIT allows physical therapists, doctors, and researchers to quantitatively measure underlying mechanical inefficiencies and target any problematic areas. With this information, they can develop the right exercises to properly address the patient’s specific needs.
Quantity and Quality Assessment
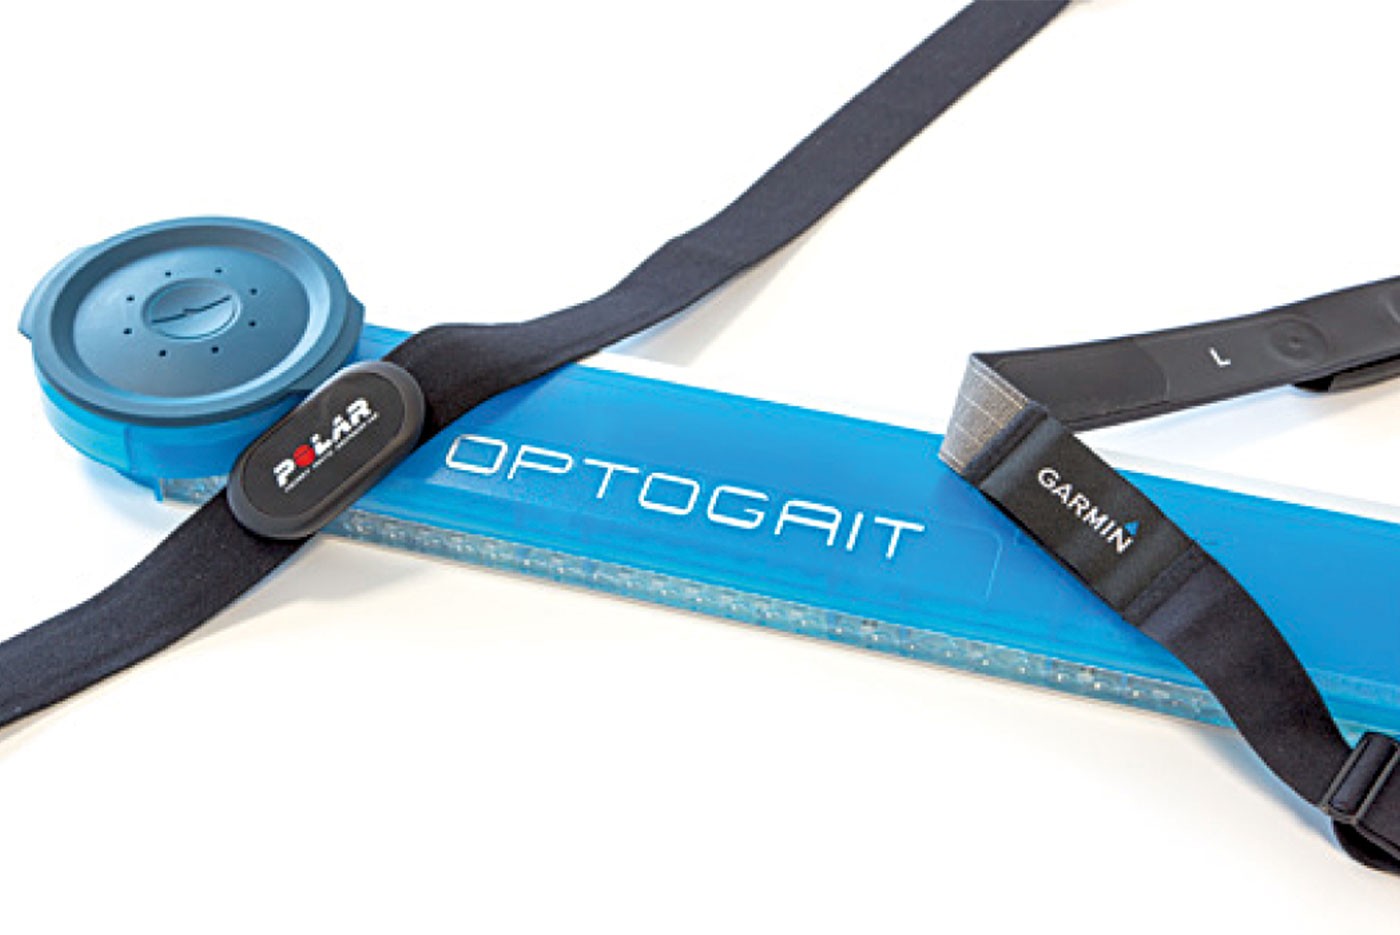
Optogait acquires numerical parameters in real-time for gait, running and jump tests that can be viewed immediately. The easy to read report contains all data, and asymmetries between the two legs are highlighted instantly. Optogait does not only detect the numerical data, but, via small cameras, which can be freely positioned, it allows the user to acquire images of carried out tests, synchronizing them perfectly with detected events. Without the need for any further synchronization between hardware and cameras, the numerous benefits of cross verification of data and images can be fully used. A more detailed video analysis can be had by further utilizing the dedicated utility (angle, distance calculus, graphic tools, etc.).
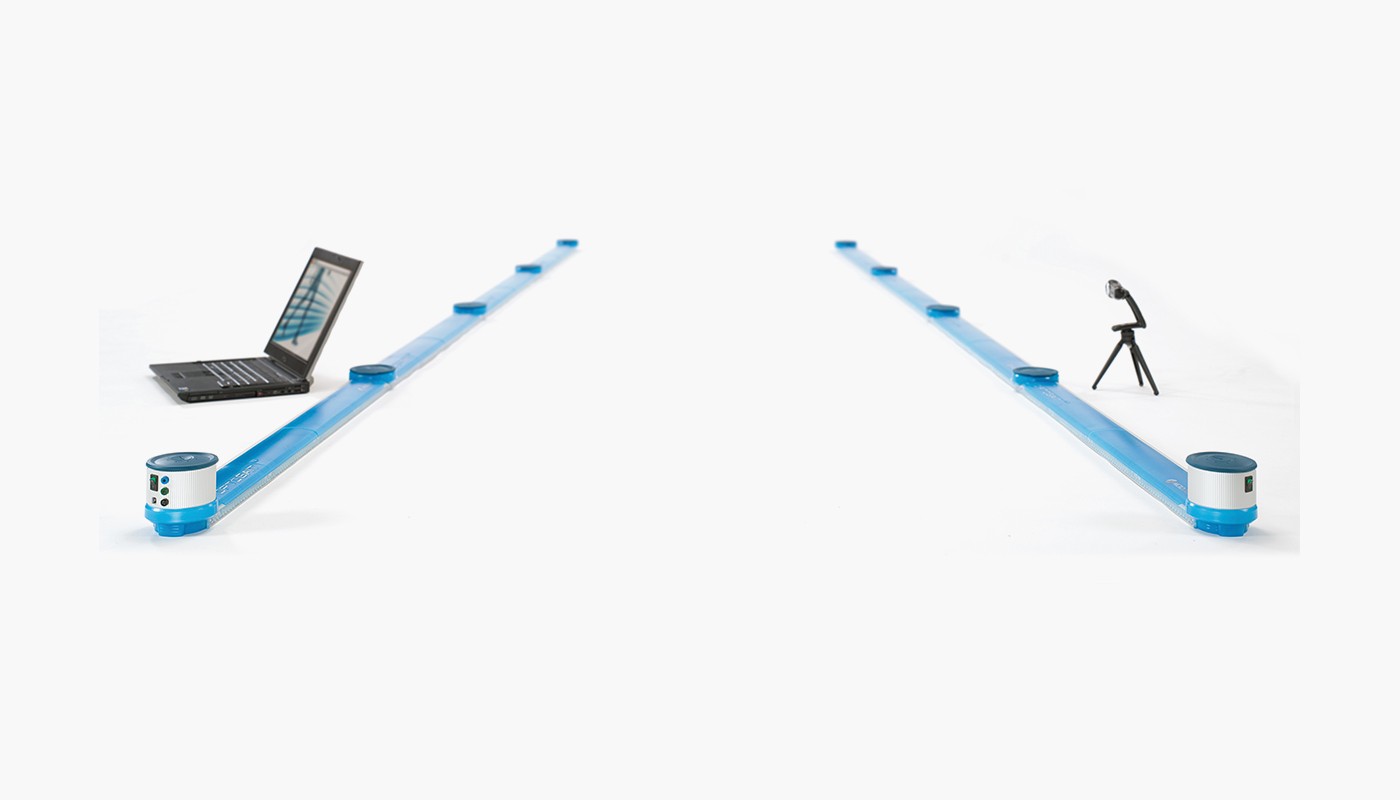
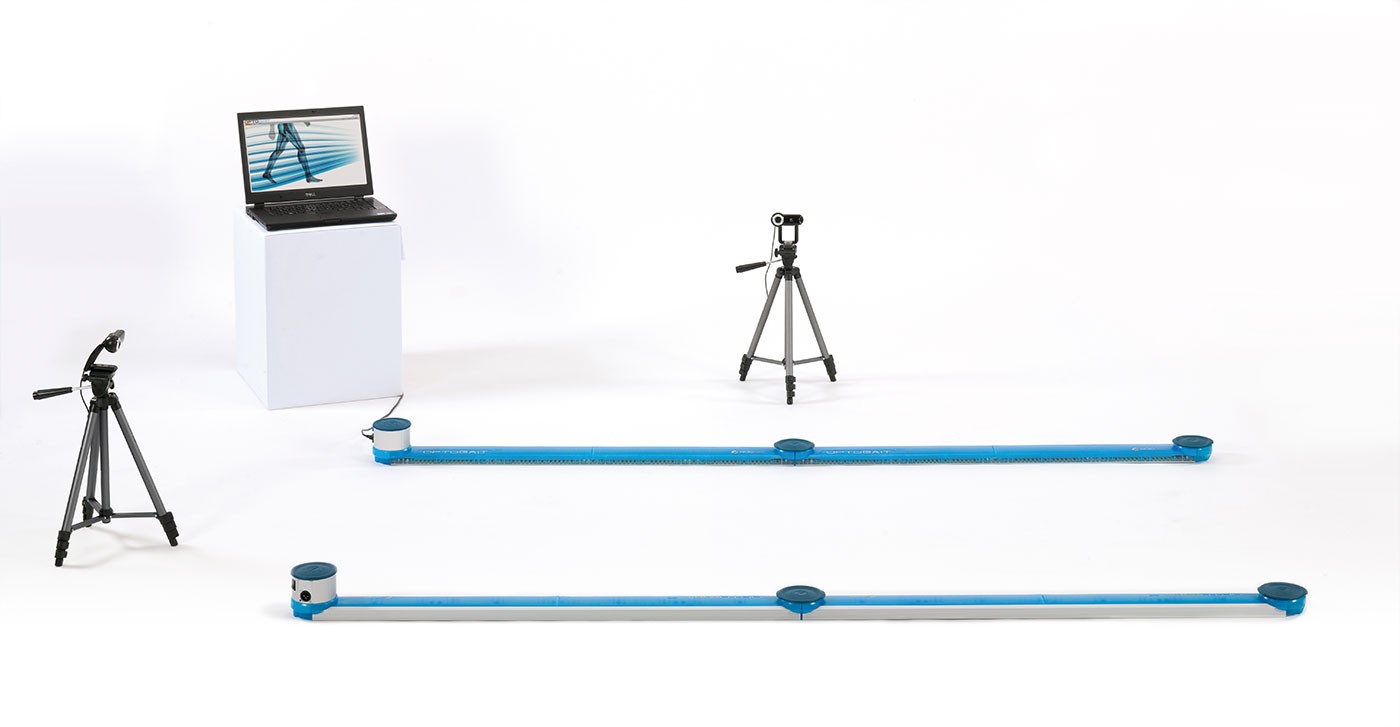
Easy and quick to install
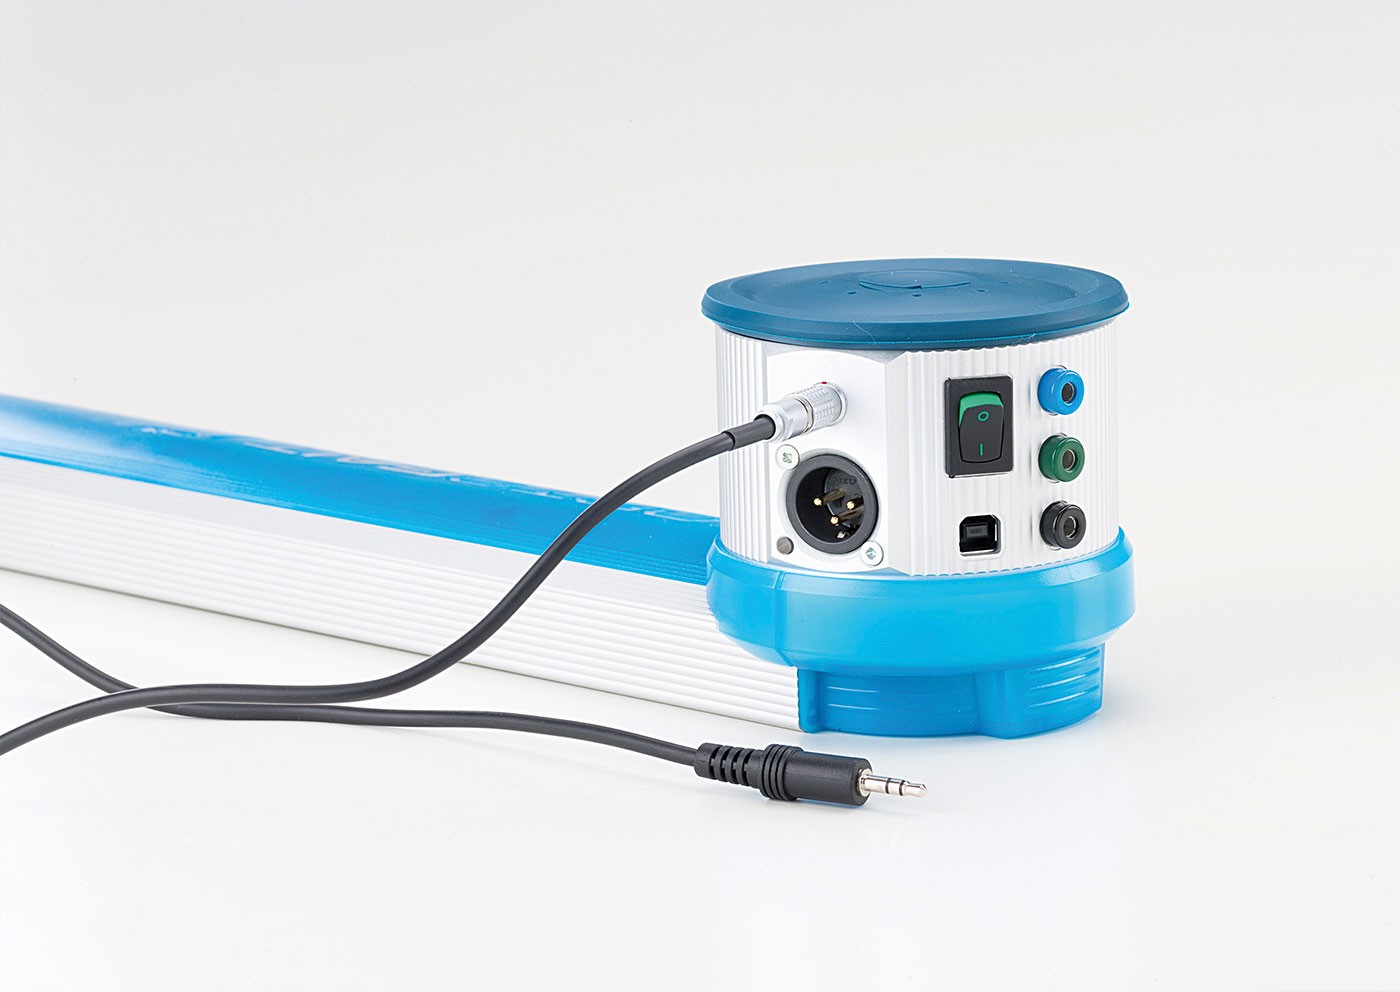
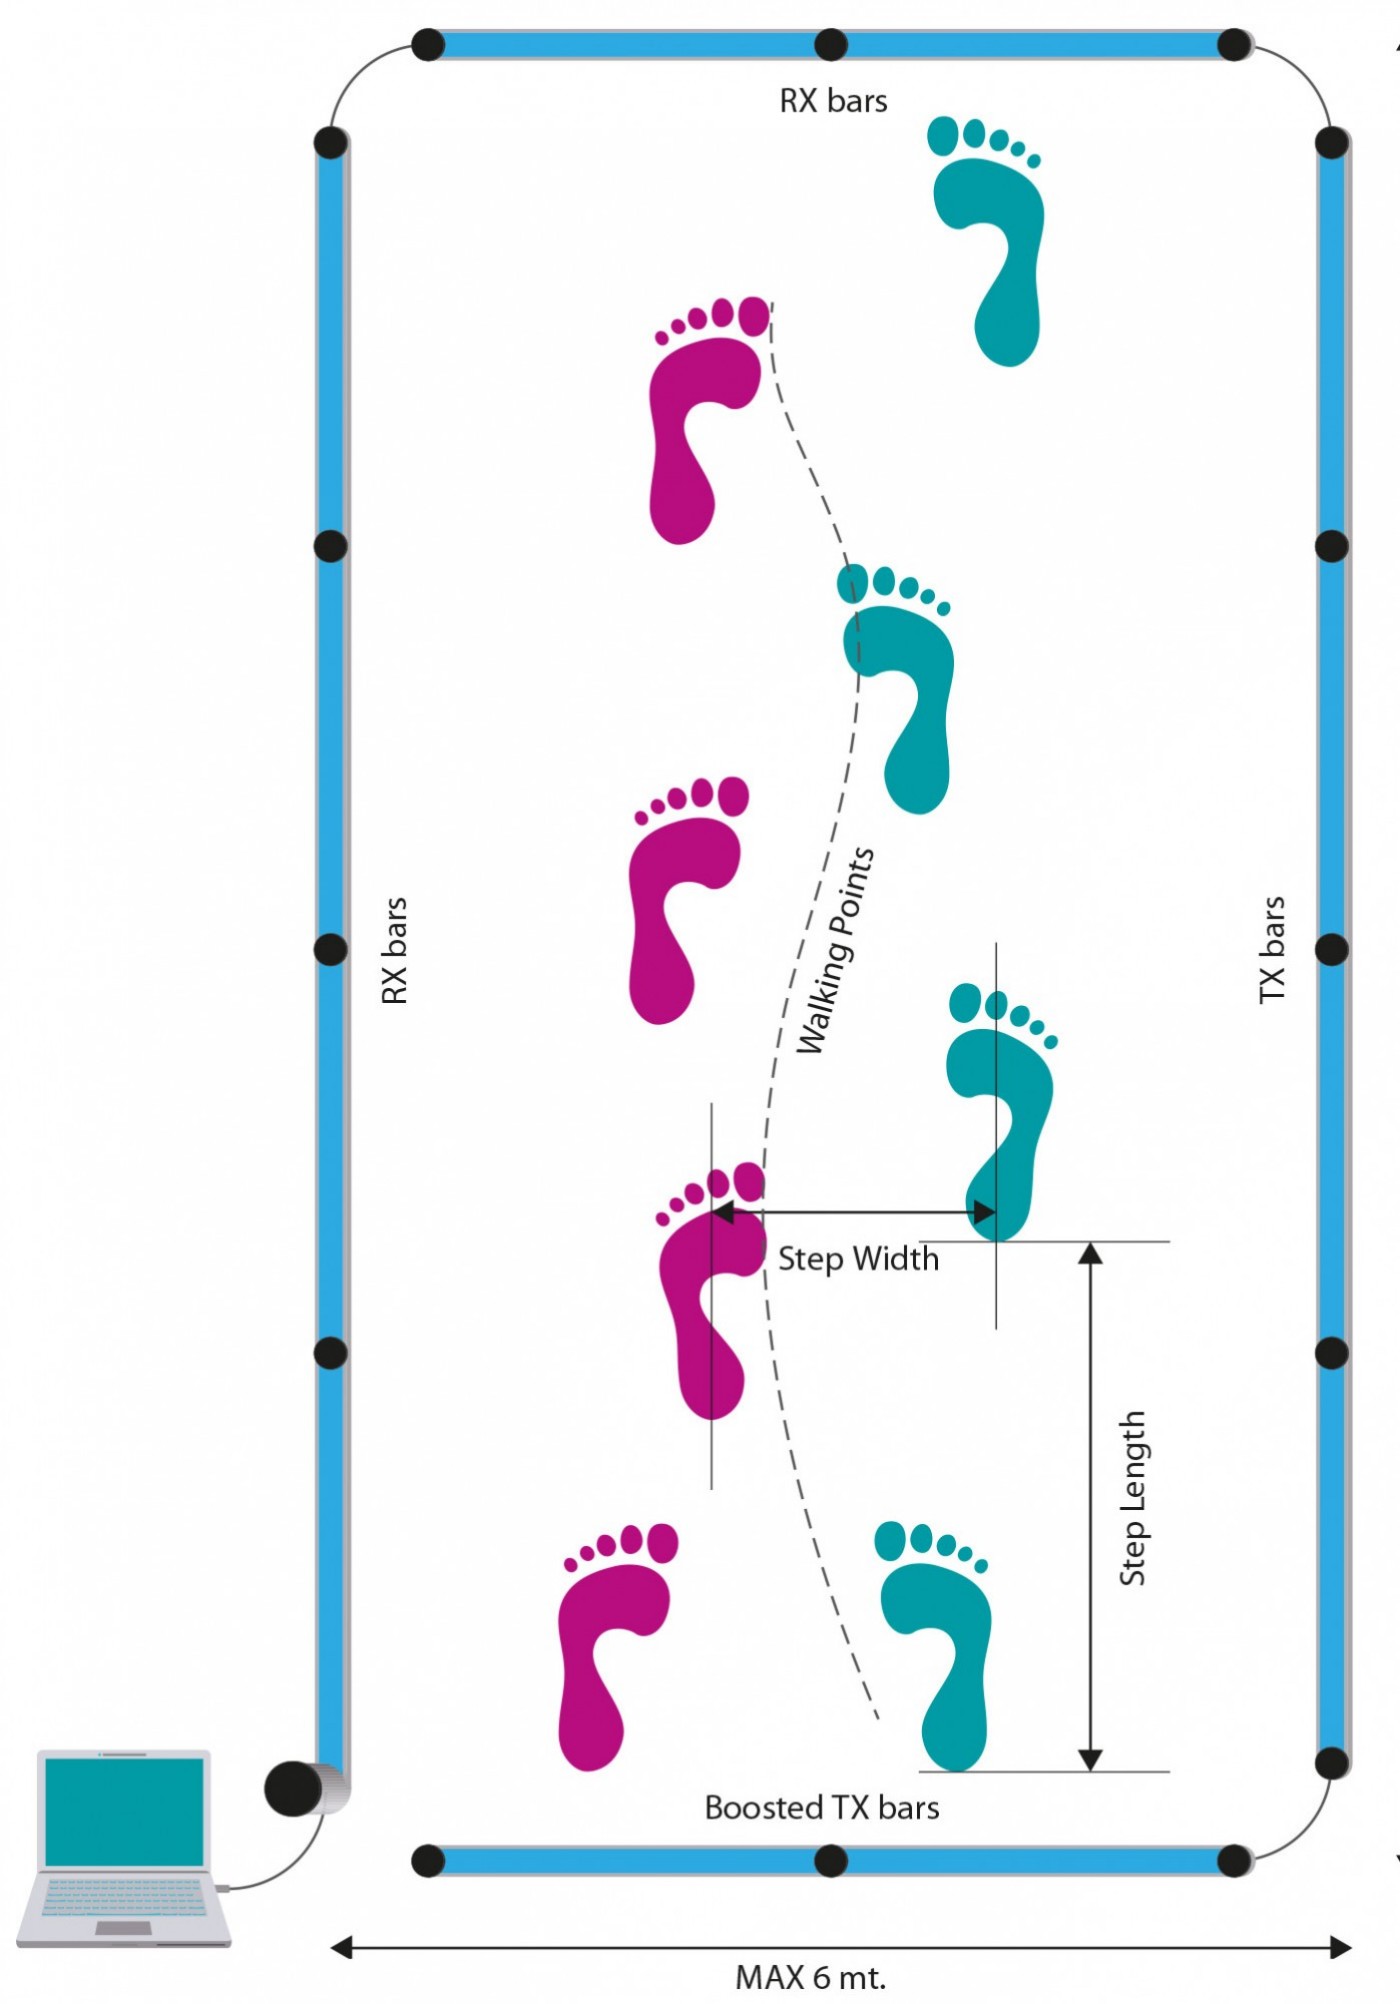
The system is extremely easy to install: position the bars on the floor and connect the receiving part to the PC using the USB cable - OptoGait is ready to be used! The maximum distance between the bars is 6 meters and there is no need for connection cables. This makes the bars easy to move with minimal disturbance to the patient on which the test is carried out. The correct alignment of the system is shown by a green LED. If the bars are not parallel or in case of any imperfections on the floor influencing the communication between the transmitting and the receiving part, the LED emits a red light to warn the user.
The Software
The interface with which the OptoGait system is managed is divided into three main sections: Patients' data, Tests and Results.
Patients
This is the section where the patients’ profiles are created and stored. A profile can contain all sorts of information: personal data, notes, patient’s photo, etc. Each patient can be added to one or more groups or subgroups. Therefore the Patients’ Personal Data can be fully customized and adapted to the user’s requirements, and imported and/or exported from/to other programs or formats (xml, Excel, etc.).
Tests
This section is the software’s nerve center. It is accessed to devise and configure new tests (jump, reaction, running, etc.) and to perform tests by choosing from the pre-defined tests or those created by the user. It is furthermore possible to group several tests (protocols), if this is useful for measuring particular capacities or conditions (some protocols are already pre-configured, e.g. for measuring reactivity and dynamic stability).
During the test, the user receives three kinds of feedback in real-time: numerical, graphical, and video (from one or two webcams). If the starting foot has been previously selected, the results are calculated assigning the values to the left or right leg. Once confirmed the test, all three types of data are stored and are available for immediate editing or further use in future. The user can also temporarily hide certain unnecessary information (e.g., if the video is of importance for the user, the images can be viewed full-screen).
Results and video analysis
The tests carried out previously can be recalled at any moment accessing the Results area. Selecting a test and clicking on ‘View’, (numerical or graphical) data can be compared with the images. The video is of great help to the user to detect immediately postural or motor problems, and, more in general, to carry out a qualitative analysis. In fact, thanks to the ‘video memory’, possible anomalies of the numerical data can be easily identified and motivated.
The video images are synchronized with the data. This allows to verify with accuracy what has happened at the time of acquisition of a certain value (e.g. if a contact time is extremely long, it is possible to look for the cause viewing the images of the instant, when the value has been recorded). Synchronization is carried out automatically by the software; no user action is necessary. The video reproduction speed can be reduced down to a still image, to view the video frame-by-frame. A video analysis utility is also provided, with traditional tools such as lines, arches, circles, text, ruler, goniometer to measure angles and other.
In the Results section two or more tests can be compared (‘Compare’ option) using the video as well as the data, having all necessary information at disposition. This allows to quickly and intuitively carry out an analysis of quantitative and qualitative differences between tests carried out at a different time (pre-/post- rehab, for example) or between different patients (healthy and rehab).
If more than two tests are to be compared, the ‘History’ function must be used, which allows to select an infinite number of tests to verify the parameters (indicated when a patient’s progress must be measured constantly carrying out numerous tests). All data, numerical and graphical, can be printed or exported to the most common formats.
Report
After having carried out and saved a test, two reports are immediately available:
- Gait/Run report: specific report for gait or running tests, with average values, standard deviation and variability coefficient of all typical parameters for the left and right leg. Furthermore, any possible asymmetries and imbalances between the legs can be spotted instantly. The same report type is available when selecting two tests, allowing for a quick comparison thanks to a graphically intuitive and clear interface. Gait/Run reports show also if the patient’s parameters are within the normal range of values.
- Extended Report: contains all numerical and graphical data, stored step by step during the test. In both report types it is possible to add screenshots taken with the video utility available in the ‘View’ option, as well as in the ‘Compare’ option
| Zwischensumme netto | 14.995,00 € |
| MwSt. 19% | 0,00 € |
| Gesamtbetrag (brutto inkl. MwSt.) | 14.995,00 € |